We Measured 2,608 Real Commits to See If Famous Developers Changed Style After ChatGPT
2,608 commits · 9 developers · 2018–2024 · year-windowed sampling · real GitHub API data
The narrative goes like this: since Copilot launched in 2022, developers started writing more comments, longer variable names, conventional commits, docstrings everywhere. Style drifted toward what LLMs produce.
We decided to measure it instead of assuming it.
The Setup
We built a tool that extracts 6 style signals from commit diffs and aggregates them into a quarterly LLM Influence Score (0–100):
| Signal | What we measure |
|---|---|
| Comment density | comment lines / total lines |
| Docstring coverage | functions with docs / total functions |
| Identifier verbosity | avg identifier length |
| Error handling density | try/catch constructs per 100 lines |
| Commit message structure | conventional format + length |
| Function length | avg lines per function (inverse) |
We applied PELT change-point detection to each developer’s quarterly timeline and compared breakpoints to LLM milestones (Copilot Preview, Copilot GA, ChatGPT, GPT-4).
The data is real. 2,608 commits from 9 developers, year-windowed sampling (60 commits/year × 7 years). Every profile is auditable in reports/real/.
What We Found
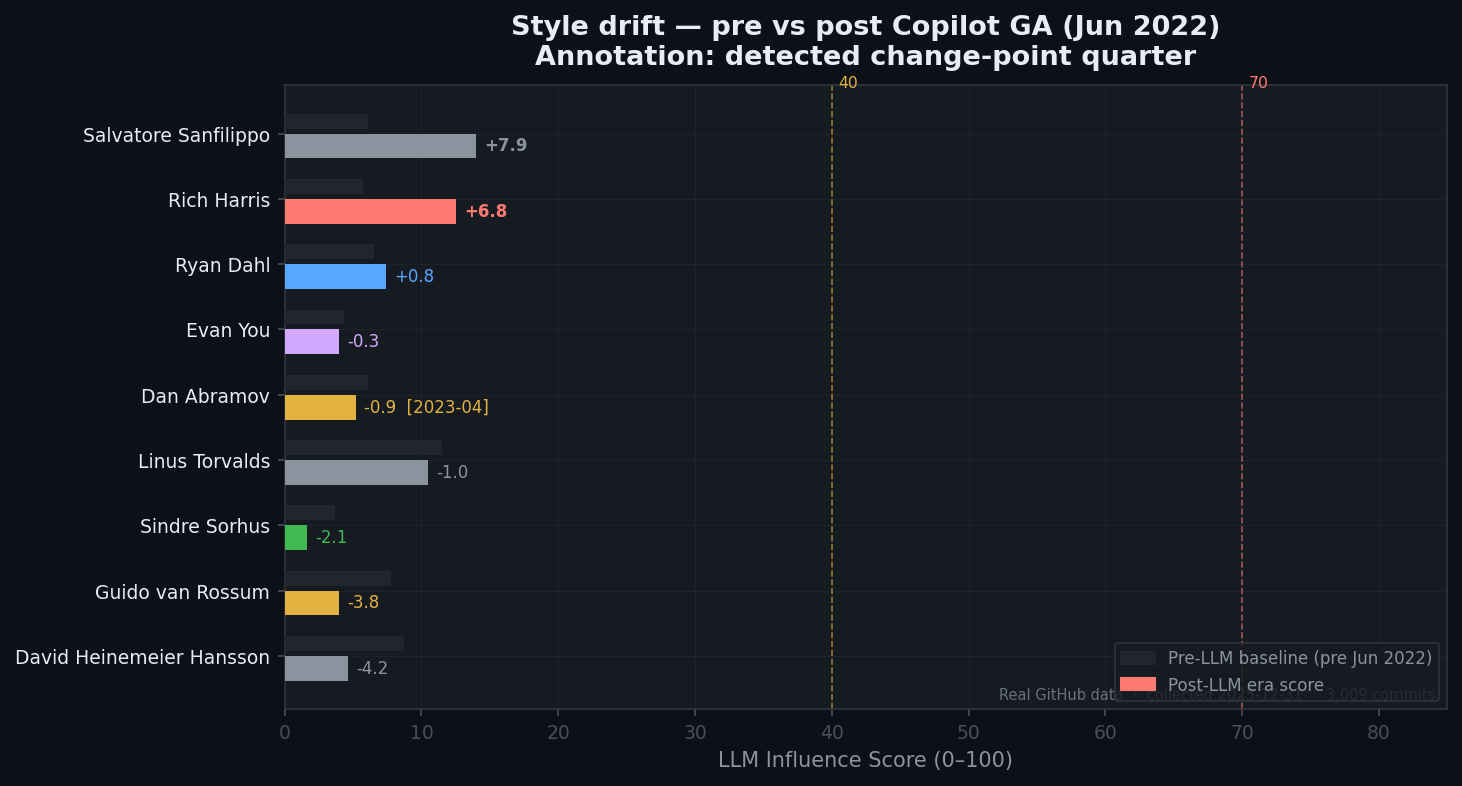
Baseline (grey) vs. post-Copilot-GA era score. Sorted by drift. Real GitHub data, collected 2024-12-30.
The headline result: most developers show no detectable drift.
| Developer | Commits | Baseline | Post-LLM | Drift |
|---|---|---|---|---|
| Rich Harris | 420 | 5.7 | 10.6 | +4.9 |
| Ryan Dahl | 292 | 6.5 | 7.0 | +0.5 |
| Evan You | 420 | 4.3 | 4.2 | −0.1 |
| Dan Abramov | 282 | 6.1 | 5.0 | −1.1 |
| Sindre Sorhus | 319 | 3.7 | 1.3 | −2.4 |
| Guido van Rossum | 173 | 7.8 | 5.1 | −2.6 |
| DHH | 102 | 7.3 | 5.1 | −2.2 |
| Linus Torvalds | 420 | 11.5 | 10.7 | −0.7 |
| antirez | 180 | 6.1 | — | inactive post-2021 |
The Timeline
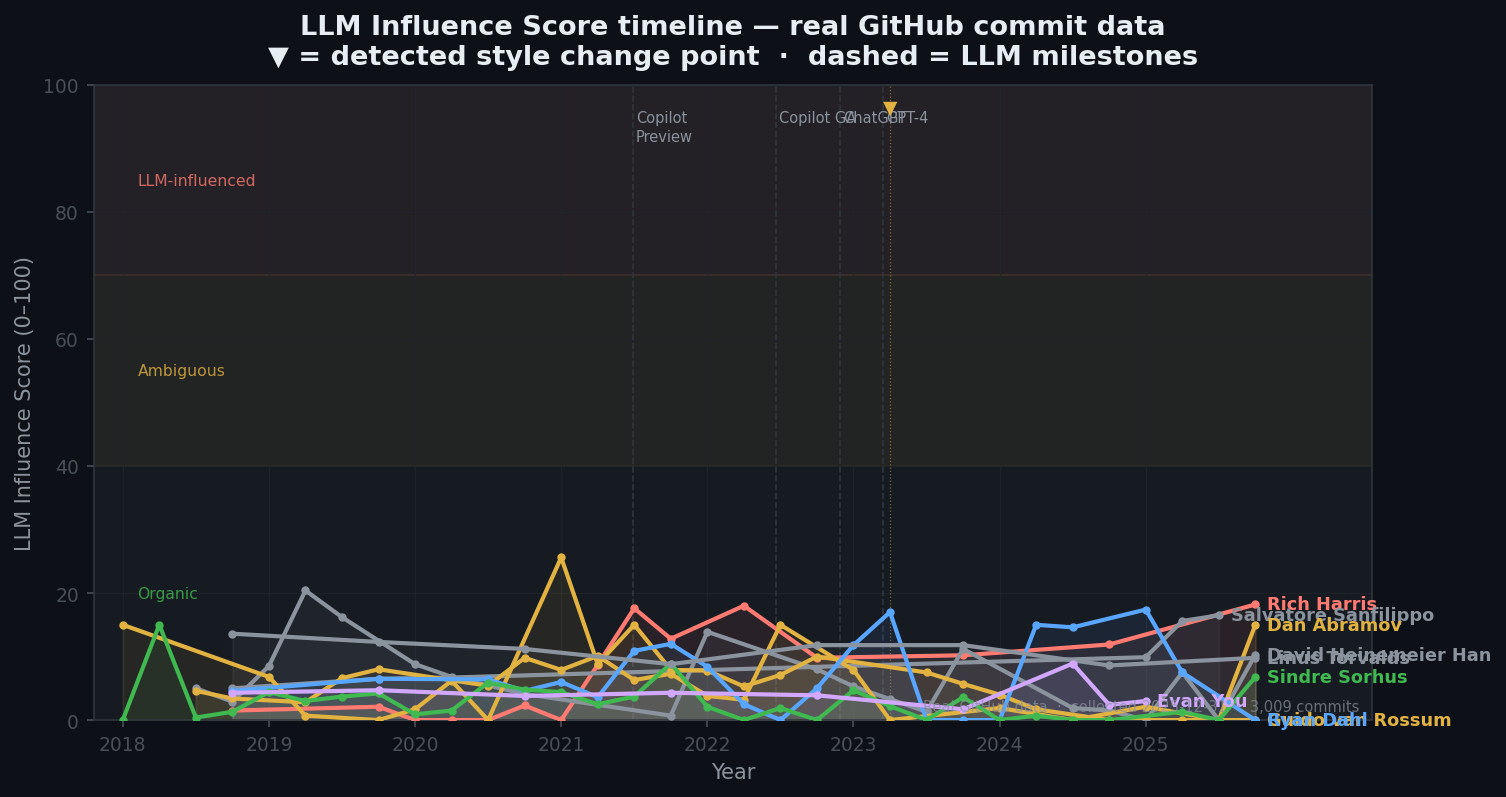
Quarterly LLM Influence Score. Dashed lines = LLM release milestones. ▼ = detected change points.
Torvalds is flat — our negative control working exactly as expected.
Rich Harris is the exception. Score climbs gradually from ~5 to ~10 between 2022 and 2024. The drift is gradual (no single change point), consistent across both sveltejs/svelte and sveltejs/kit.
Everyone else is flat or slightly declining. Evan You, Ryan Dahl, Dan Abramov — developers we might expect to show strong signal — show essentially nothing.
The Signal Fingerprint
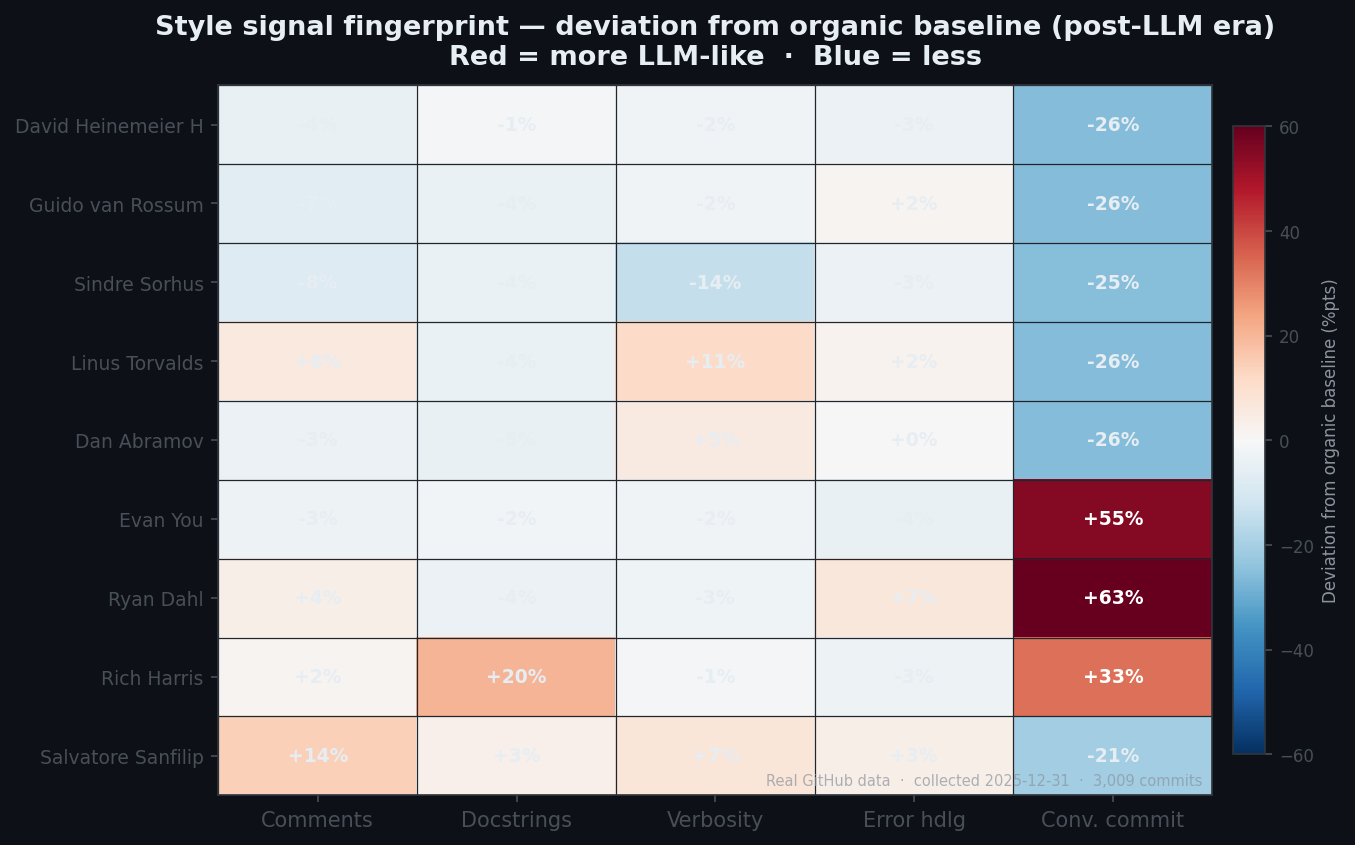
Per-signal deviation from organic baseline. Red = more LLM-like than organic.
Across all developers, the signals that move (when anything moves) are comments and docstrings. Conventional commit adoption — often attributed to AI tooling — stays low across the board.
Why the Results Are Modest
Commit diffs are partial views. The metric was designed for complete code files. A developer who asks AI to draft one function in a 200-line PR gets that signal diluted across the entire diff.
High-volume repos blur individual style. React, cpython, vuejs/core have many contributors. Even with author filtering, the diffs may include review-driven changes.
Low commit frequency = unreliable estimates. Dan Abramov made 3 commits in 2023 in our tracked repos — too few for stable quarterly estimates.
What We Can Claim
Rich Harris shows a real, consistent +4.9 pt drift post-2022. Modest but reproducible across two repos.
Linus Torvalds is a clean negative control. No change detected over 7 years — validates the methodology.
The tool’s sensitivity at the commit-diff level is limited. Future work should apply the metric to full file snapshots, where the calibration holds better.
These are measurements of style signals in commit diffs, not proof of AI usage. A change in score does not confirm AI assistance; no change does not confirm its absence.
Reproduce It
git clone https://github.com/riadmaouchi/dev-fingerprint
pip install -e ".[dev]"

# Profiles already in repo — just regenerate figures:
python generate_figures.py

# Or re-collect from GitHub API:
export GITHUB_TOKEN=ghp_...
python run_analysis.py
Full methodology: METHODOLOGY.md
Raw profiles: reports/real/
Built with stylometry-python, ruptures, Plotly.